In my piece, Using Mapping to Scope a System, I covered the process of using Mind Maps, Cluster Maps and Concept Maps/Models to help you scope the boundaries of a system and to identify what all the actors, elements and actions might be within the boundaries of the system.
In this piece I am going to talk about a suite of models that can help us understand what’s happening within the system. These are Stock/Flow Diagrams, Connection Circles, and Feedback Loops and I want to walk through how you construct these models so that you can start to understand the relationships and influences between elements within the system. The models will help us identify where those influences create behavioral reinforcing or balancing loops and will visualize positive and negative outcomes or directions happening within the system.
Understanding these connections and interactions can help us identify places and opportunities we can leverage to make changes that might affect the state or outcome of the system we are working with.
When I first started learning about these more specific types of system models, I had a hard time grasping how to read them, what they were for or even why would we do them. Now that I’ve been teaching this for a few years, I have started to integrate these into modeling projects I am doing for clients and find them helpful to get my head around the topic or software I am working with, especially if I am trying to understand the complexity from different angles.
Often the models are done to inform ourselves in order to make sense of what’s happening. But they can also be used to help mediate conversations and to clarify points of view and understanding about how things are working and where we need to put our attention. This series of models dives deeper into those interconnections and influences.
Stock Flow diagrams
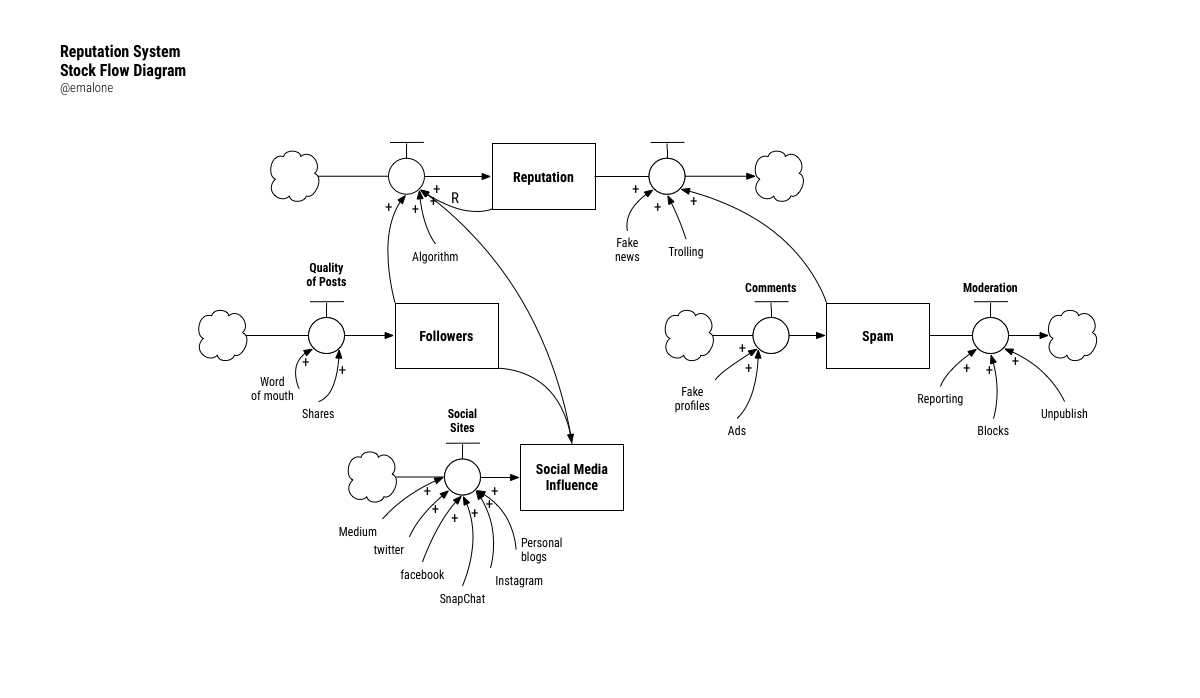
A stock flow diagram shows interdependencies and feedback within a system by identifying major accumulations and the elements and actions that increase and decrease those accumulations over time.
Anything within the system that can be accumulated is a Stock. This might be things like posts or articles read or page views or time on site or a thousand other things we see in digital experiences. It can also be an abstract concept like happiness or love. Generally stocks are Nouns which can be both concrete and abstract. To best identify which stocks to include in a diagram, we need to analyze the critical behaviors of the system. We might do this through Concept Models to understand relationships or Behavior Over Time graphs to see changes over time.
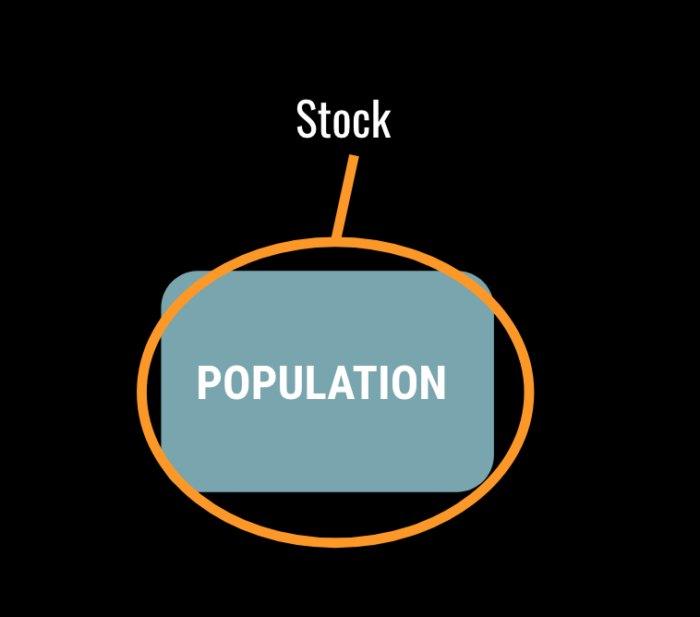
In the model, we represent the stock with by a box.
A stock may have an input flow (increase) or an output flow (decrease) or both. A flow can have multiple influences and can have stacked influences, i.e. one element can influence another which then can influence the flow to increase or decrease.

The Flows in and out are represented by an arrow into the Stock and an arrow out of the Stock. On each arrow there is a round circle with a lever on top. This symbol represents the levers that turn up or turn down the flow in and out of the stock. Like the hot and cold controls of a faucet.
The elements that influence the flow, Connectors, indicate that changes in one element cause changes in another element. Conceptually, these increase or decrease the flow. (Stocks can only be affected through flows, therefore you should not attach a connector directly to a stock.)
Using the example of Reputation in social experiences, if we write this out in a narrative form it reads something like this: An increase in posts, likes, quality, reposts, can increase (the input flow) a person’s online reputation within the system (the stock). An increase in self-promotion, ads, spam, or trolls in the comments, as well as a decrease of posts or decrease in quality of those posts, can decrease (the output flow) a person’s reputation within the system (the stock).
Writing it out can help clarify how this idea of reputation works but it is hard to visualize these influences in text and it’s a mouthful to describe. Frankly, my eyes glaze over a bit when trying to read it and understand what is happening. We can draw it out and visually understand the ins and outs and influences to the stock, reputation. See the two examples below.
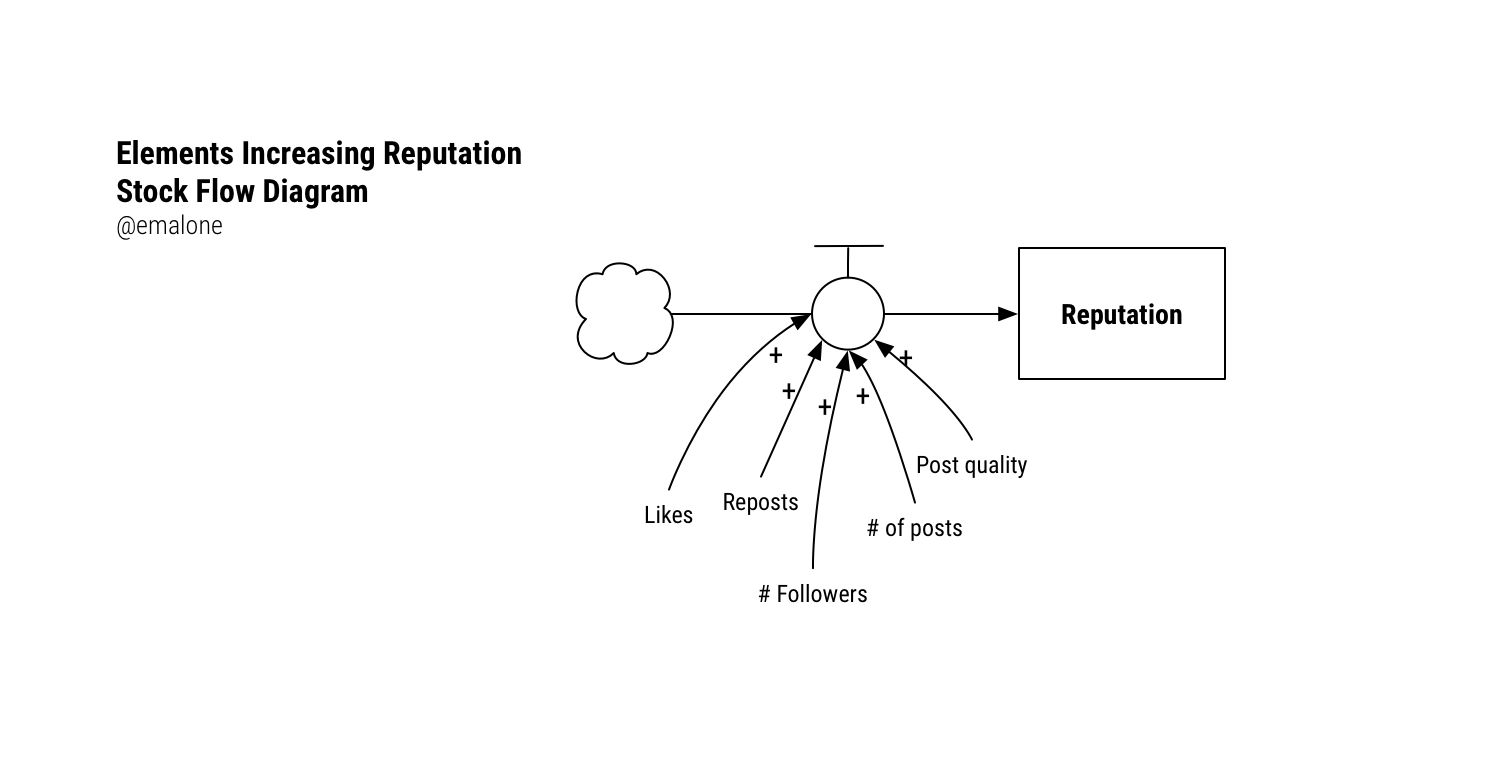
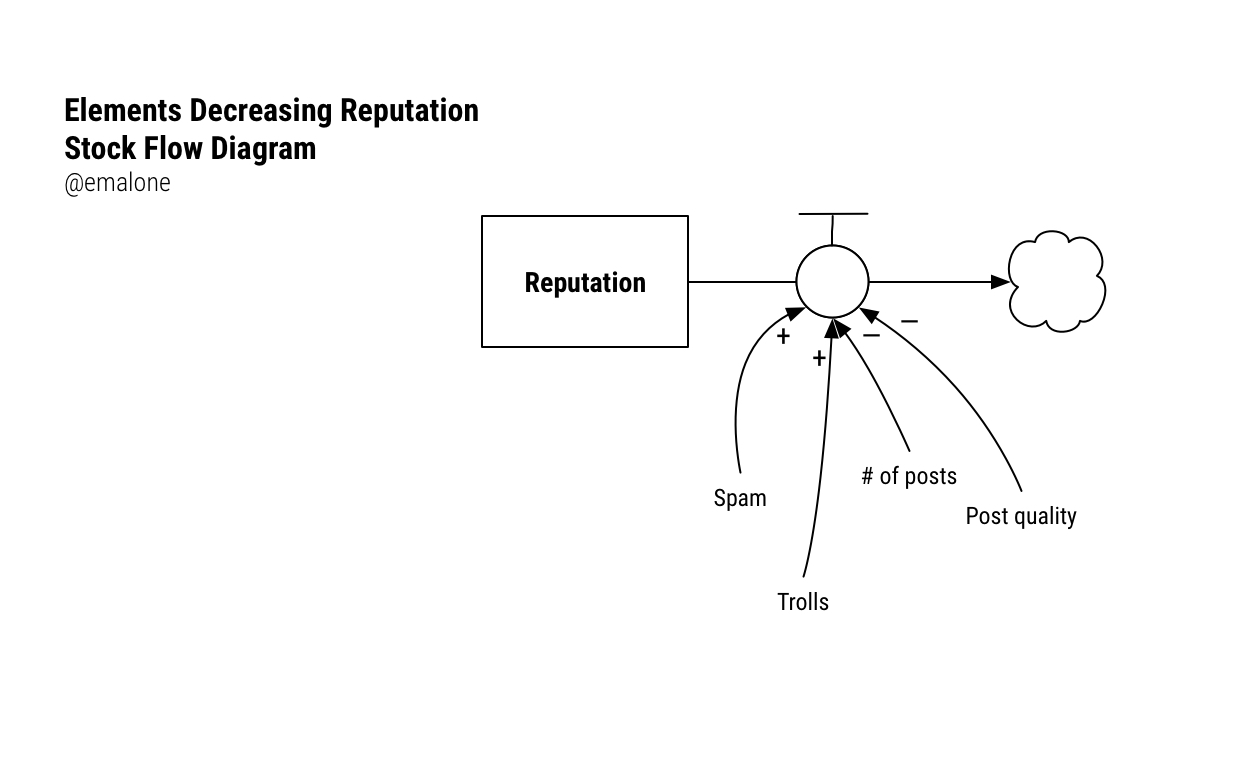
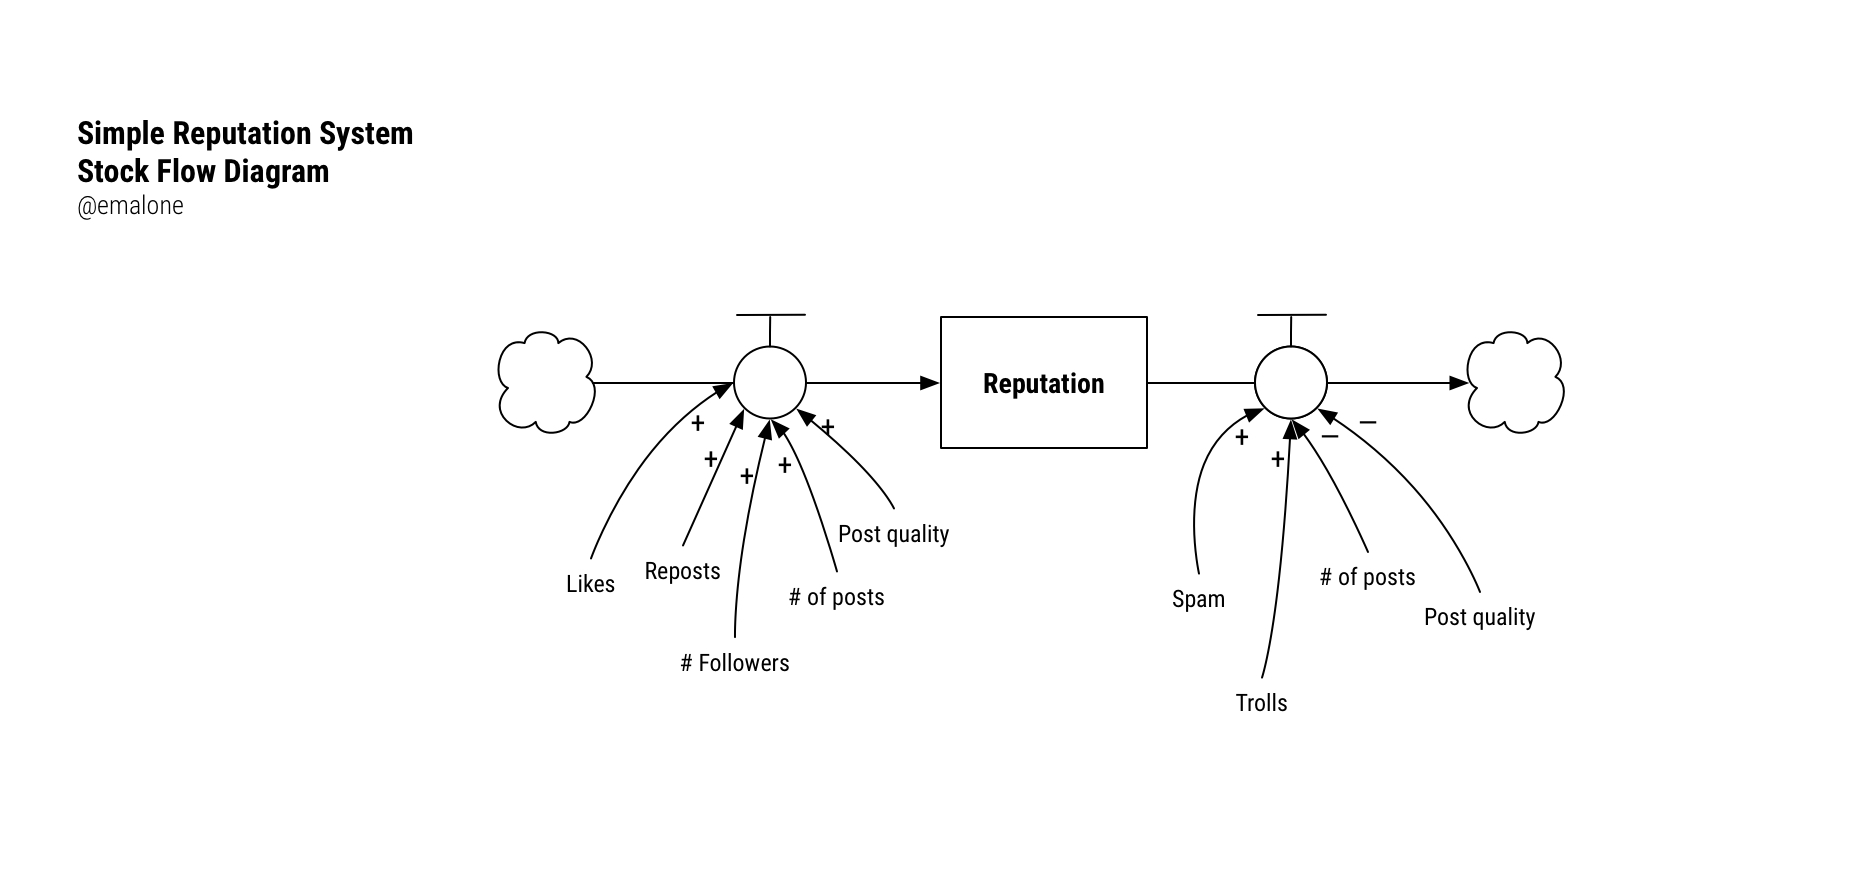
Once you have done a simple stock flow diagram about an area in a system, you can start to identify other stocks in the overall larger system. Analyzing these in the same way, we can look at how these may be interconnected and influence each other. We may start to see the emergence of some feedback loops which we can further deconstruct through the process of making a Connection Circle.
More resources for understanding stock flow diagrams –
https://thesystemsthinker.com/step-by-step-stocks-and-flows-improving-the-rigor-of-your-thinking/
https://thesystemsthinker.com/systems-thinking-tools-a-users-reference-guide/
Connection Circles
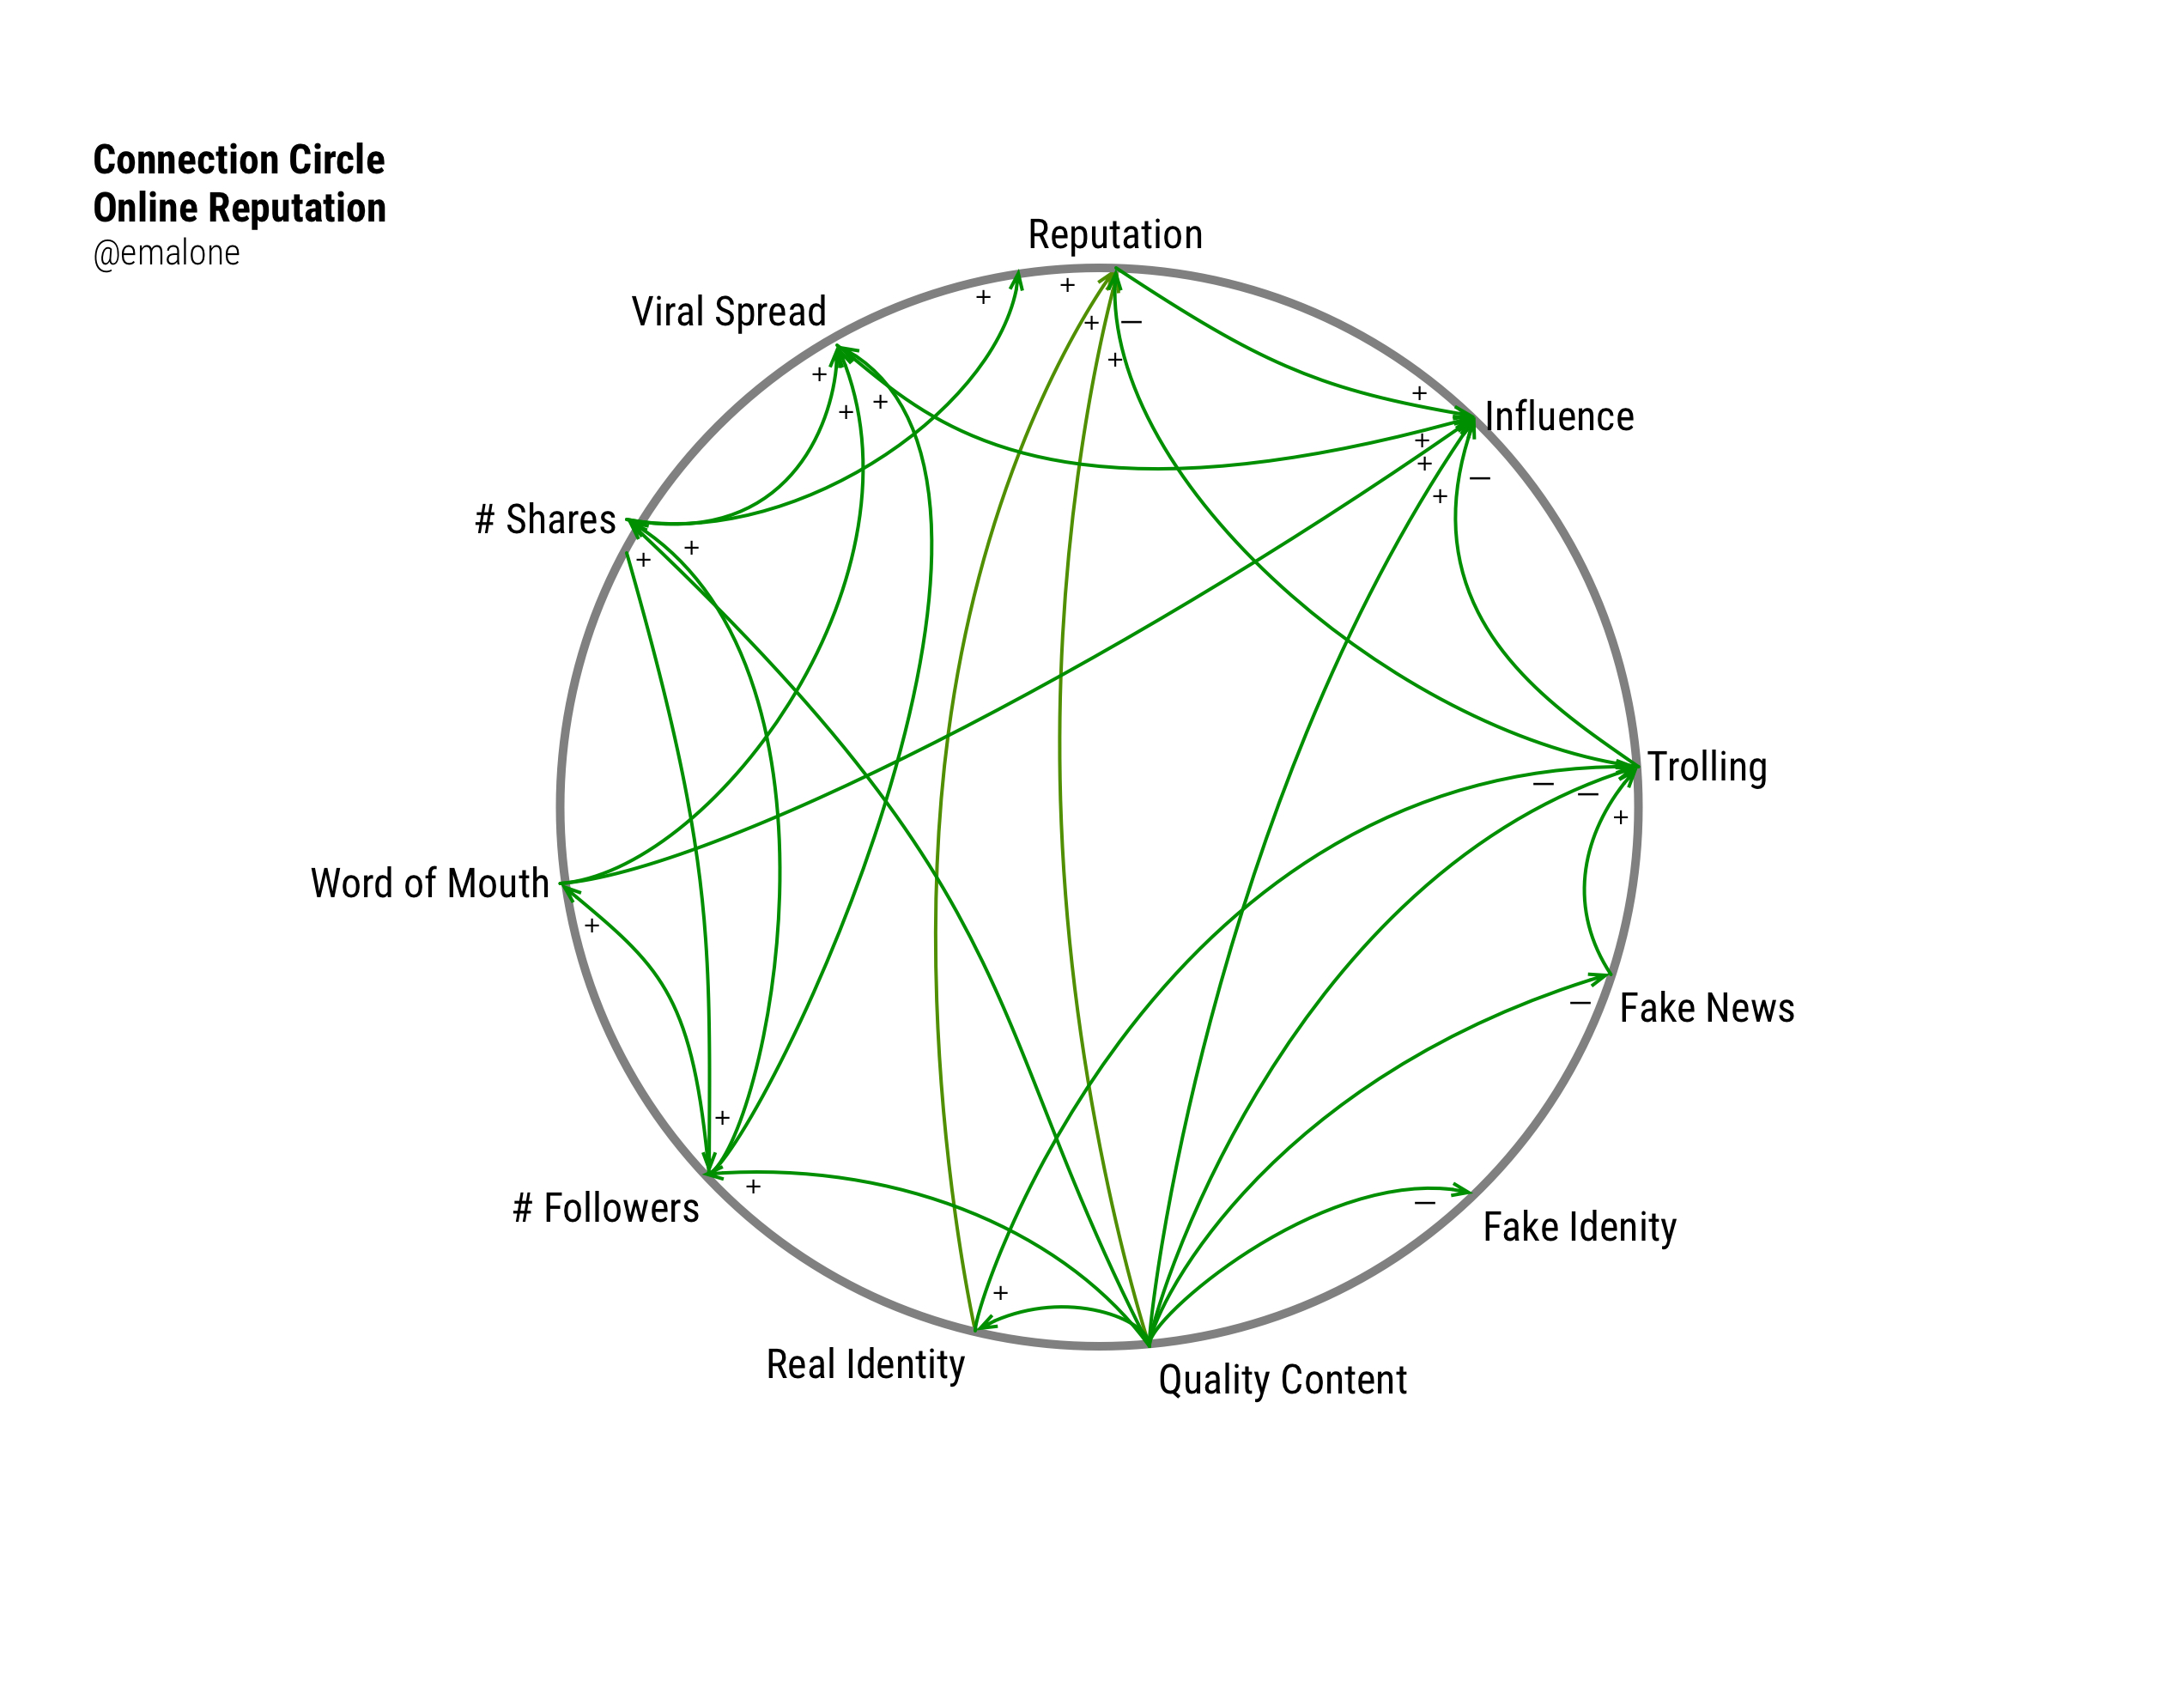
Using what we learned from making our Cluster Map and Concept Model, we can list out the actors of the system and the actions we have observed or understand to be true. Making a Connection Circle helps us tease out interconnections and to see which of those elements have some sort of effect on another element. We can use this to help identify feedback loops and then we can then dig in further to understand where we might find points of leverage to effect change within the system.
Making a Connection Circle step by step:
Identifying the elements
- Document all parts of the system on post-its – one concept/agent/element per post it note. Elements should be relevant to the system, nouns or noun phrases and dynamic.
- Draw a large circle on a large sheet of paper
- Place the post-its around the outside of the circle
Documenting relationships
- Draw connections between the parts
- Identify causality: elements that cause other elements to change (increase or decrease). If desired, create behavior-over-time graphs around the circle for each of the elements. This process of looking at the connections between elements helps you to understand the interconnectedness of the parts and how they influence each other.
- Draw an arrow from the “cause†element to the “effect†element.
Showing increases and decreases because of relationships
- If the “effect”— element increases because of the connection, label the arrowhead with “+” (indicating that an increase in the first element causes the second element to rise)
- If the “effect” element decreases because of the connection, label the arrowhead with a “-“ (indicating that an increase in the first element causes the second element to fall).
Identifying Feedback loops
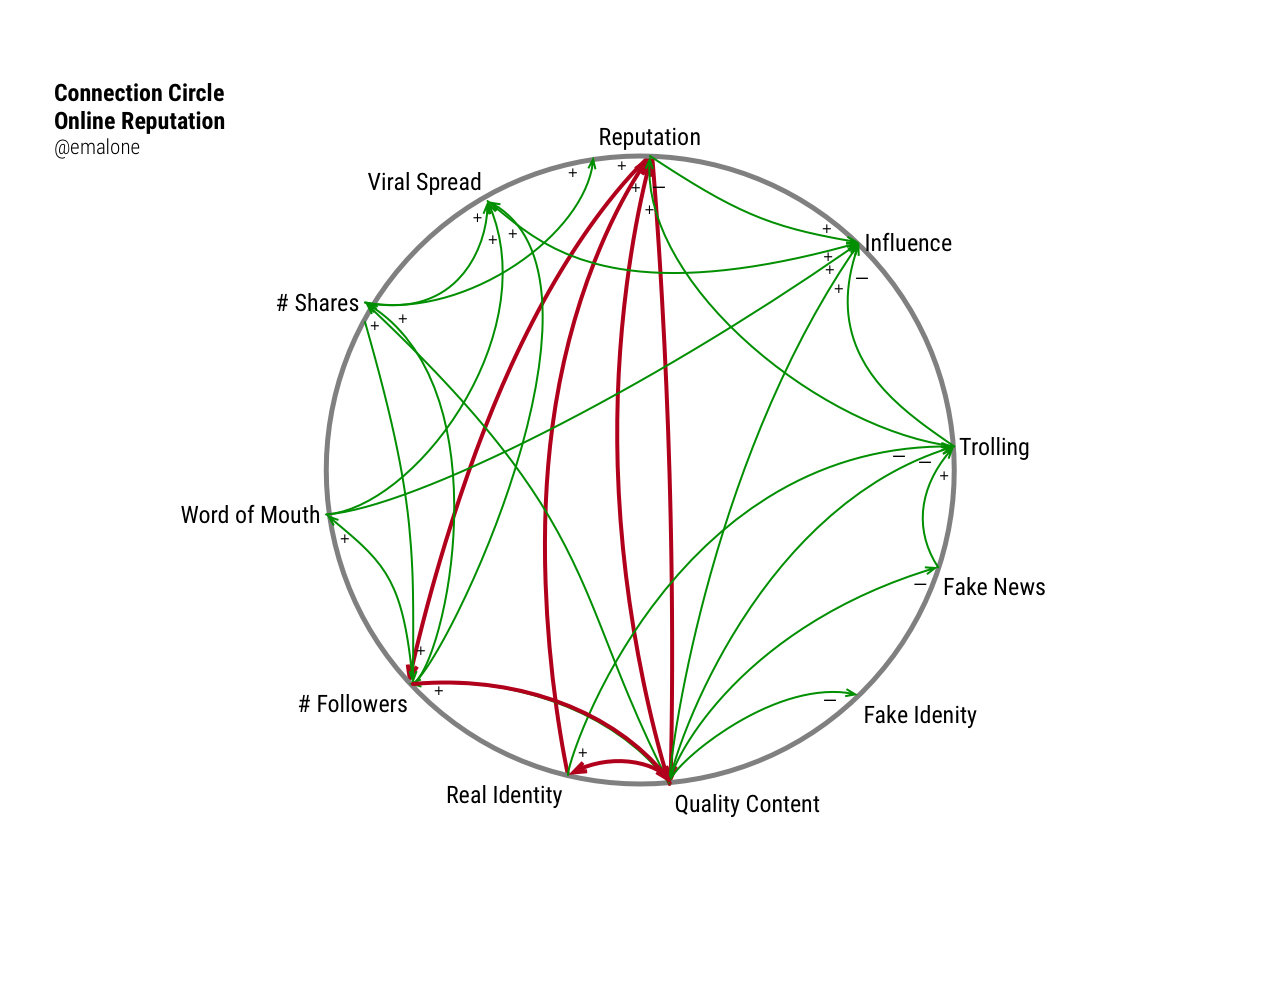
- Identify and analyze feedback relationships in the circle.
- To find a feedback loop, look for arrows in sequence that lead back to the original element. These feedback relationships can be shown in causal loop diagrams which I will describe next.
- Tell the ‘story’ of the relationships represented within the connection circle. What’s happening? Why do you think this is happening? Is this a positive or a negative loop? What might you do to change the effect of this influence or behavior? Are there time delays that happen in the system that make this difficult to predict?
Working through both the Stock Flows of a system and reframing the information into a Connection Circle, lets you deconstruct and analyze the elements that could be important to pay attention to. You don’t necessarily need to do both, but it doesn’t hurt to look at the information through a different lens.
More information for making and understanding Connection Circles:
https://thesystemsthinker.com/learning-about-connection-circles/
Feedback Loops
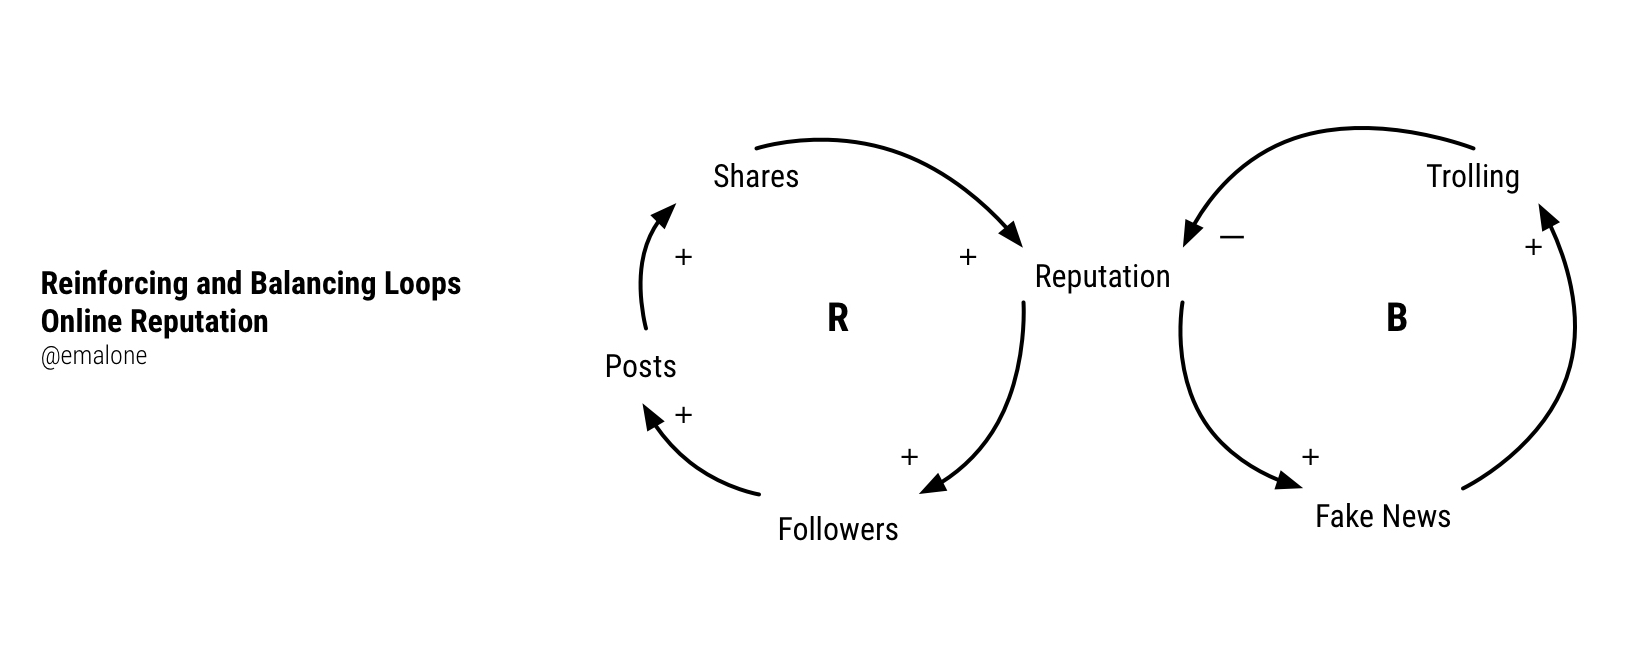
To better understand the system, the delays, the changes over time and the causes of those changes, look at the feedback or causal loops emerging from your analysis. There are two types of feedback loops we see. Balancing and Reinforcing feedback loops and these can be either positive or negative. Don’t be fooled by their names though, a reinforcing loop isn’t necessarily “positive”often referred to as a vicious loop. On the other hand, it can also be called a virtuous loop when the results are what you intended. What this means is that the behavior of one element influences another and that in turn comes back to influence the first in the same direction – growing or decreasing. The loops either keep the system in equilibrium or causes stocks to rise or fall steadily. The loop doesn’t always tell you what elements in the system are stocks though, so it’s important to work through stock flow diagrams as well to give you a more complete picture of what is happening.
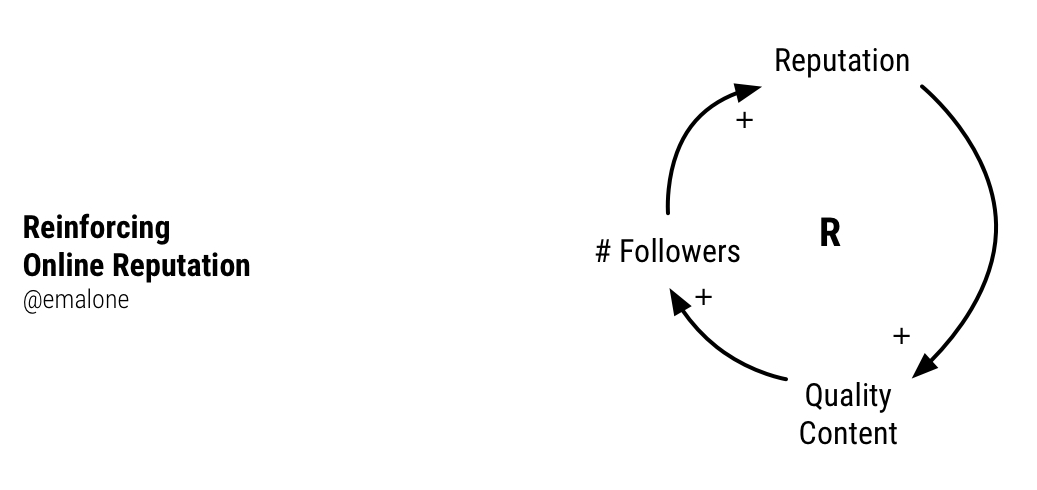
Loops are either one or the other, reinforcing or balancing, but not both. If you feel like you are seeing both in a single loop, then more deconstruction and analysis needs to happen to tease out which parts are really the balancing loop and which parts are the reinforcing loop. A good rule of thumb to assess whether a causal loop is reinforcing versus balancing is to count the number of opposite directions (o / – ) or same direction (s / + ) indicated by the cause and effect. An odd number of o’s indicates a balancing loop and an even number or zero indicates a reinforcing loop. Think of driving and making a U turn. An odd number of U turns will have you driving the same direction as before and an even number changes the direction (analogy from the systems thinker.com Systems Thinking User’s Reference Guide).
In our social Good Online Reputation example, more shares of fake news on Facebook means more people will see it. The more people who see it, the more shares there will be. It’s a spiraling loop that reinforces itself. To keep this loop in some sort of equilibrium, an even amount of people would need to stop sharing than those who do, to balance it out.
Another example can be seen in climate change. The more C02 in the atmosphere, the greater the greenhouse gasses affect warming in the polar ice caps. The more the polar ice caps warm, the faster they melt, leading more sun being absorbed which leads to more melting. For a long time there were enough delays in the system, that people had a hard time understanding the cause and effect of greenhouse gasses to climate change, but as the loop has reinforced itself, with more people, more gasses, the speed of climate change has increased dramatically and the lengths of the delays has decreased.
Once you have an understanding of the various positive and negative feedback loops in the system, you can analyze where there might be delays in the loop (time delays between an action and when the effect of that action can be seen in the system) and what impact those delays have. What’s been happening? Why is this happening? When is it happening? How can we improve the performance? These are all questions that we can start to uncover as we analyze these dynamic relationships.
Gaining further clarity will also come from analysis using Behavior Over Time graphs to help define and understand the cause, effect and delays within the system over some time duration.
More resources for making and understanding Feedback loops –
https://thesystemsthinker.com/fine-tuning-your-causal-loop-diagrams-part-i/
https://thesystemsthinker.com/fine-tuning-your-causal-loop-diagrams-part-ii/
Conclusion
Each of these types of models can help you gain perspective into the workings of complex systems. By visualizing the different aspects and their effects on each other, you can gain a greater understanding of potential issues as well as opportunities for making improvements. You will understand which parts of the system influence and have effects on other parts of the system and whether that causes the system to expand/grow or contract/shrink towards it’s inherent goal or whether it is maintaining some sort of equilibrium. As you explore each type of model to triangulate an understanding of the system you can see that no single model tells the whole story but each leads us down the path to see and understand the bigger picture from a variety of perspectives.